Habits and interesting statistics about Moving

Table of contents
Why Are Americans Moving?

Here’s a breakdown of the primary reasons why Americans moved in recent years, based on percentages from various sources and the Ruby Home:
- Housing-related reasons: In 2021, 45.73% of movers cited housing prices as their primary reason for moving.
- Family-related reasons: 24.56% of movers cited family-related reasons for moving in 2021.
- Employment-related reasons: 15.77% of movers moved due to employment-related reasons in 2021.
- Other reasons: 13.94% of movers cited different reasons for their moves in 2021.
These statistics highlight that housing affordability remains the most significant factor driving relocation decisions, with family and employment opportunities also playing crucial roles.
How many moving companies are in the U.S.?

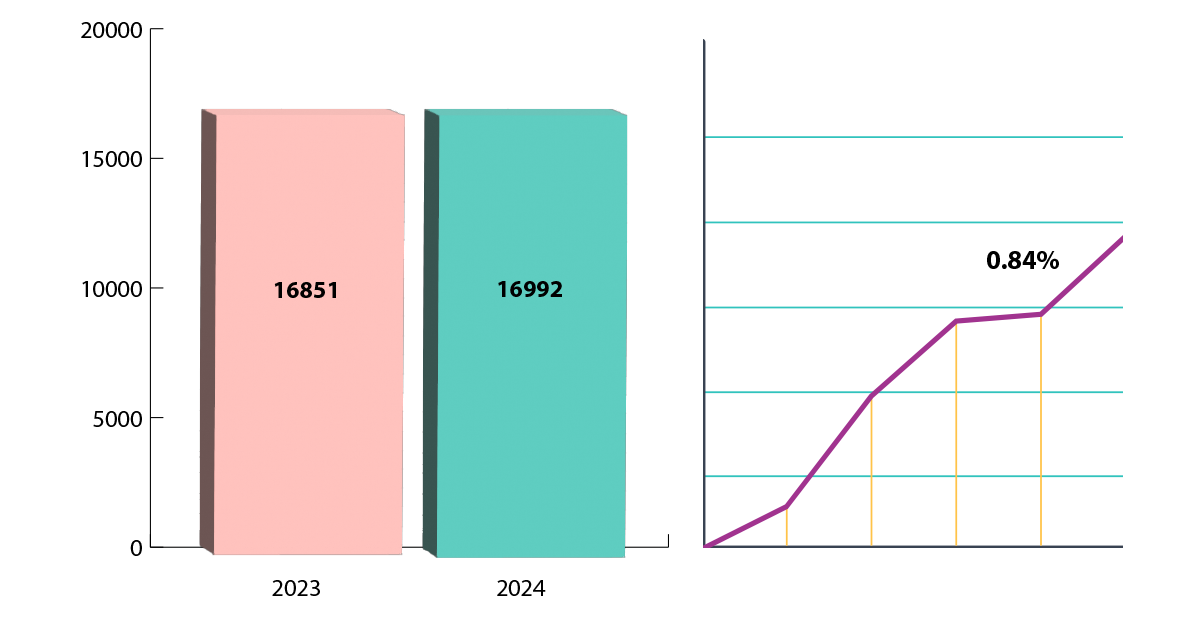
As of 2024, there are approximately 16,992 enterprises in the Moving Services industry in the United States. This represents a slight increase of 0.84% from the previous year (IBISWorld).
How many people moved in the U.S. in 2024?

As of 2024, about 8.2 million people moved between states in the United States. This represents an increase from the previous years, indicating a slight rise in state-to-state mobility. This number reflects a broader trend of increasing movement between states, especially to regions in the South and West, which have seen higher immigration rates compared to other parts of the country.
How Far Do People Move in the U.S. in 2024?

In 2024, the patterns of how far people moved within the United States are as follows:
- Within the same county: Most people who moved stayed within their county, making up 53.5% of movers.
- Between different counties within the same state: This category and interstate moves accounted for 41.7% of all moves, though the individual percentage for intra-state but inter-county moves isn’t explicitly broken down.
- Interstate moves also fall into the combined 41.7% with inter-county moves.
- From abroad: Approximately 4.9% of moves were from abroad, a significant increase from previous years and possibly a reflection of the lifting of pandemic-related travel restrictions.
These figures illustrate a diverse range of mobility. A significant number still prefer local moves within the same county, while a notable portion opts for longer-distance relocations within or across state lines. There was also an increased trend in international relocations to the U.S. in 2024.
In 2024, do more people in the U.S. move on their own or hire a moving company?

In 2024, most people moving to the U.S. choose to move independently rather than hire a moving agency. Approximately 65% of movers handle relocations, while around 35% hire professional moving services. This trend highlights a significant preference for DIY moving solutions, possibly influenced by the desire to reduce costs and maintain control over the moving process.
On average, how many times does an American move in a lifetime?
On average, Americans move about 11.7 times in their lifetime. This average can vary slightly depending on various factors such as economic conditions, job markets, and housing trends in different regions of America.
For example:
- In the Northeast, where states like New York and Massachusetts have high living costs, the frequency of moves might be slightly lower as people settle into long-term housing to avoid high rental or property costs.
- In the Midwest, with more stable housing markets and less transient job markets, people might move less frequently compared to more dynamic regions.
- In the South, especially in fast-growing states like Texas and Florida, people might move more frequently due to rapid economic growth, housing developments, and a higher influx of new residents.
In the West, particularly in states like California, high mobility can be driven by various factors, including job opportunities in tech and entertainment and the significant impact of housing costs.

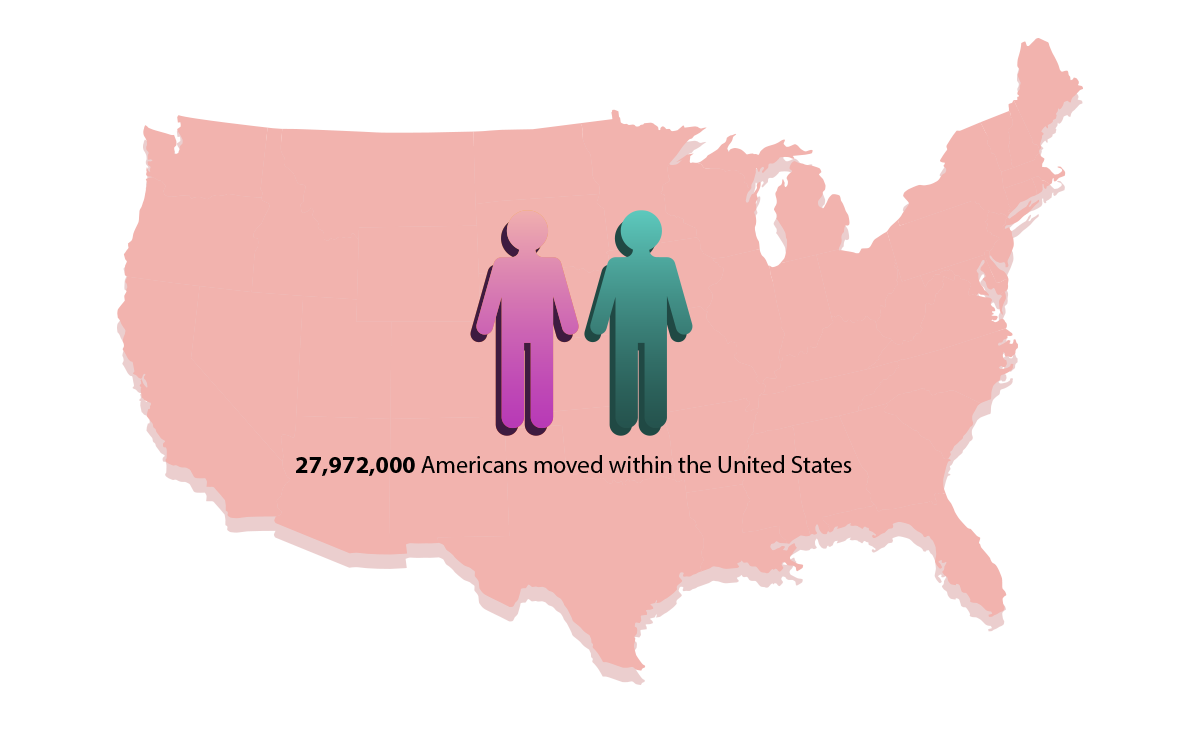
These examples are generalized; individual experiences vary widely based on personal circumstances and local factors. How many Americans moved in 2024? The answer is approximately 27,972,000 Americans moved to the United States.
What Are The Most Popular Moving Destinations in the U.S. in 2024?

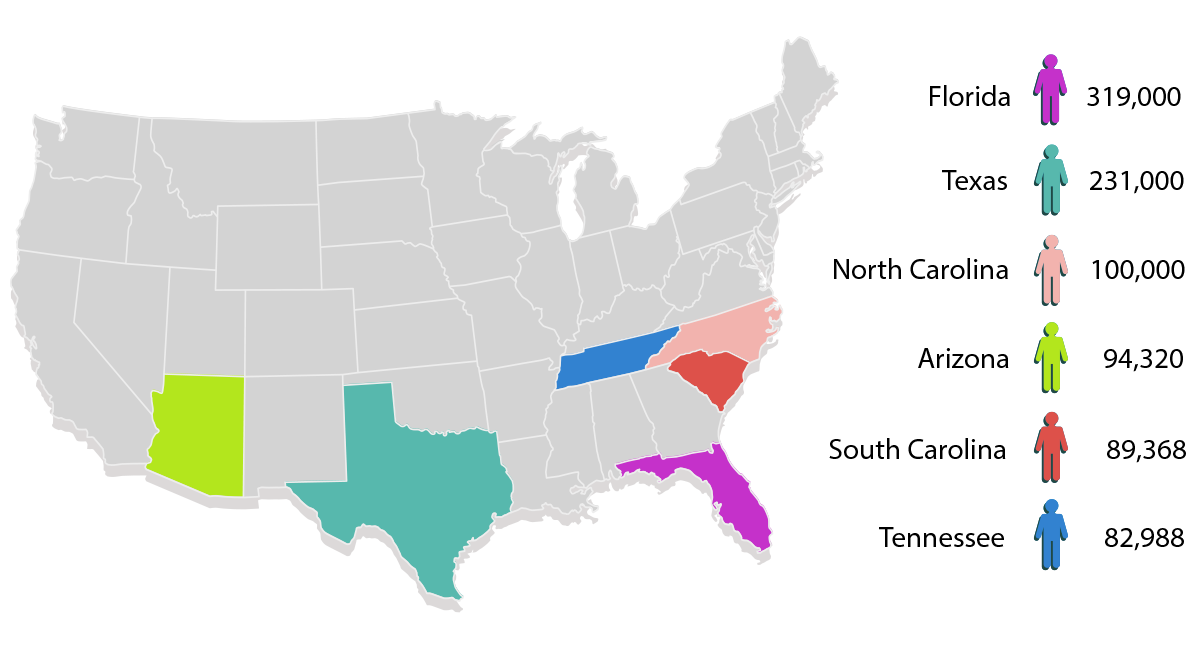
In 2024, the states that saw the most significant number of people moving in were Texas, Florida, and North Carolina. Based on the Tennessee State Data Center, Texas welcomed about 231,000 new residents from other states, while Florida saw an influx of approximately 319,000 people, and North Carolina had around 100,000 newcomers.
These states are popular mainly due to their robust job markets, affordable living costs, and pleasant climates, making them attractive destinations for families and individuals seeking a better quality of life and economic opportunities.
South Carolina, Tennessee, and Arizona also saw significant population gains. South Carolina, for instance, added about 89,368 new residents, Tennessee welcomed around 82,988 people, and Arizona saw a growth of 94,320 individuals.
These states benefit from advantages similar to those of the top three, including growing economic sectors and lower cost of living compared to more densely populated urban states.
Overall, these states have been drawing people from across the country, driven by their more favorable living conditions and opportunities for economic advancement.
What are the typical ages for people to move in 2024?

Here are the specific percentages related to the mobility rates by age for people moving in the U.S. in 2024 based on iPropertyManagement data:
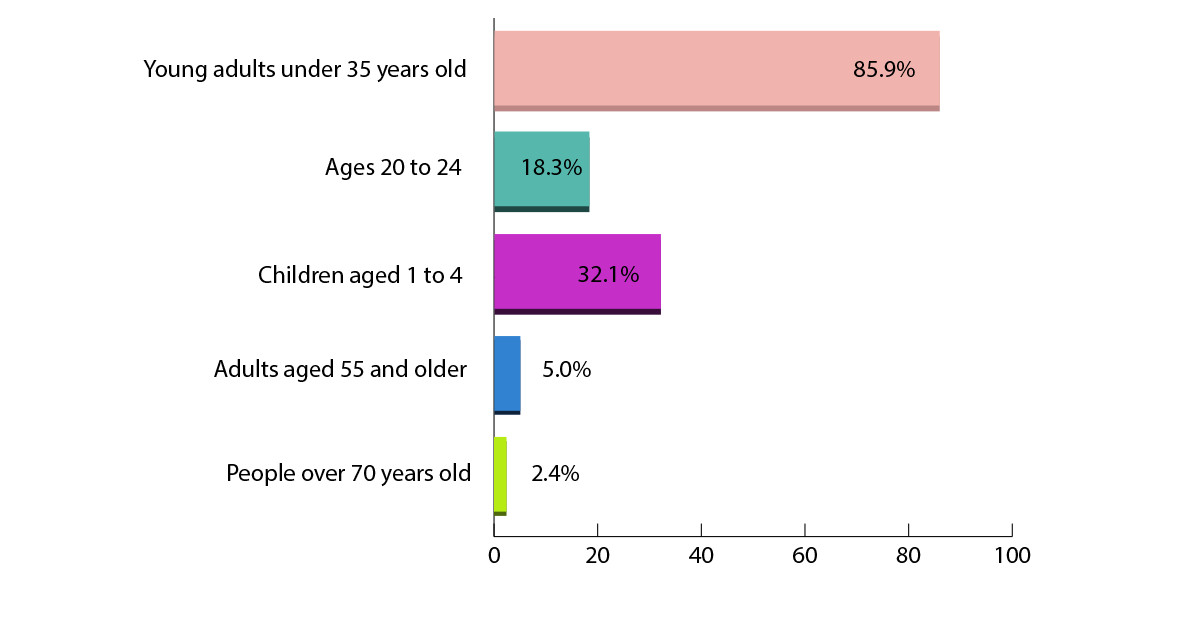
- Young adults under 35 years old: This group is 85.9% more likely to move compared to those aged 35 years and older, indicating a high level of mobility among younger individuals.
- Ages 20 to 24: About 18.3% of people in this age group move annually, one of the highest rates among age segments.
- Children aged 1 to 4: Within families that move, 32.1% of the moves involve children under 5, indicating relocation often coincides with early childhood.
- Adults aged 55 and older: The likelihood of moving drops below 5.0% annually for this age group, reflecting decreased mobility as people age.
- People over 70: Only 2.4% of this age group move in a year, the lowest percentage among all age groups.
These percentages highlight significant trends in mobility across different life stages. Younger adults exhibit the highest propensity to move, often driven by education, career opportunities, or the establishment of new households.
Make sure to share this blog post


